Address
304 North Cardinal
St. Dorchester Center, MA 02124
Work Hours
Monday to Friday: 7AM - 7PM
Weekend: 10AM - 5PM
Address
304 North Cardinal
St. Dorchester Center, MA 02124
Work Hours
Monday to Friday: 7AM - 7PM
Weekend: 10AM - 5PM
How to read a photometric report: lumens vs candela, polar distribution curves, coefficient of utilization and a four-line lux check for track lights. Read on.
A photometric report is the difference between buying lumens and buying light. Two fixtures can both say “2,000 lm, 3000K, CRI 90” and behave nothing alike once they are on your ceiling — one throws a tight, even pool with no glare, the other sprays a bright band across the room and dazzles anyone who looks up. The datasheet cannot tell you which is which. The photometric file can.
This guide walks through photometric lighting design from the documents outward: what each number in a luminaire photometric report actually measures, how to read a polar candela distribution and an iso-illuminance plot without a lighting degree, how the coefficient of utilization turns raw lumen output into a real lux figure on a real surface, and which four lines of arithmetic catch most bad luminaire choices before they reach a purchase order. Every figure below is worked out in full, so you can substitute your own readings.

A photometric report describes one luminaire’s light output in numbers, in every direction, at every angle. Four values carry most of the meaning:
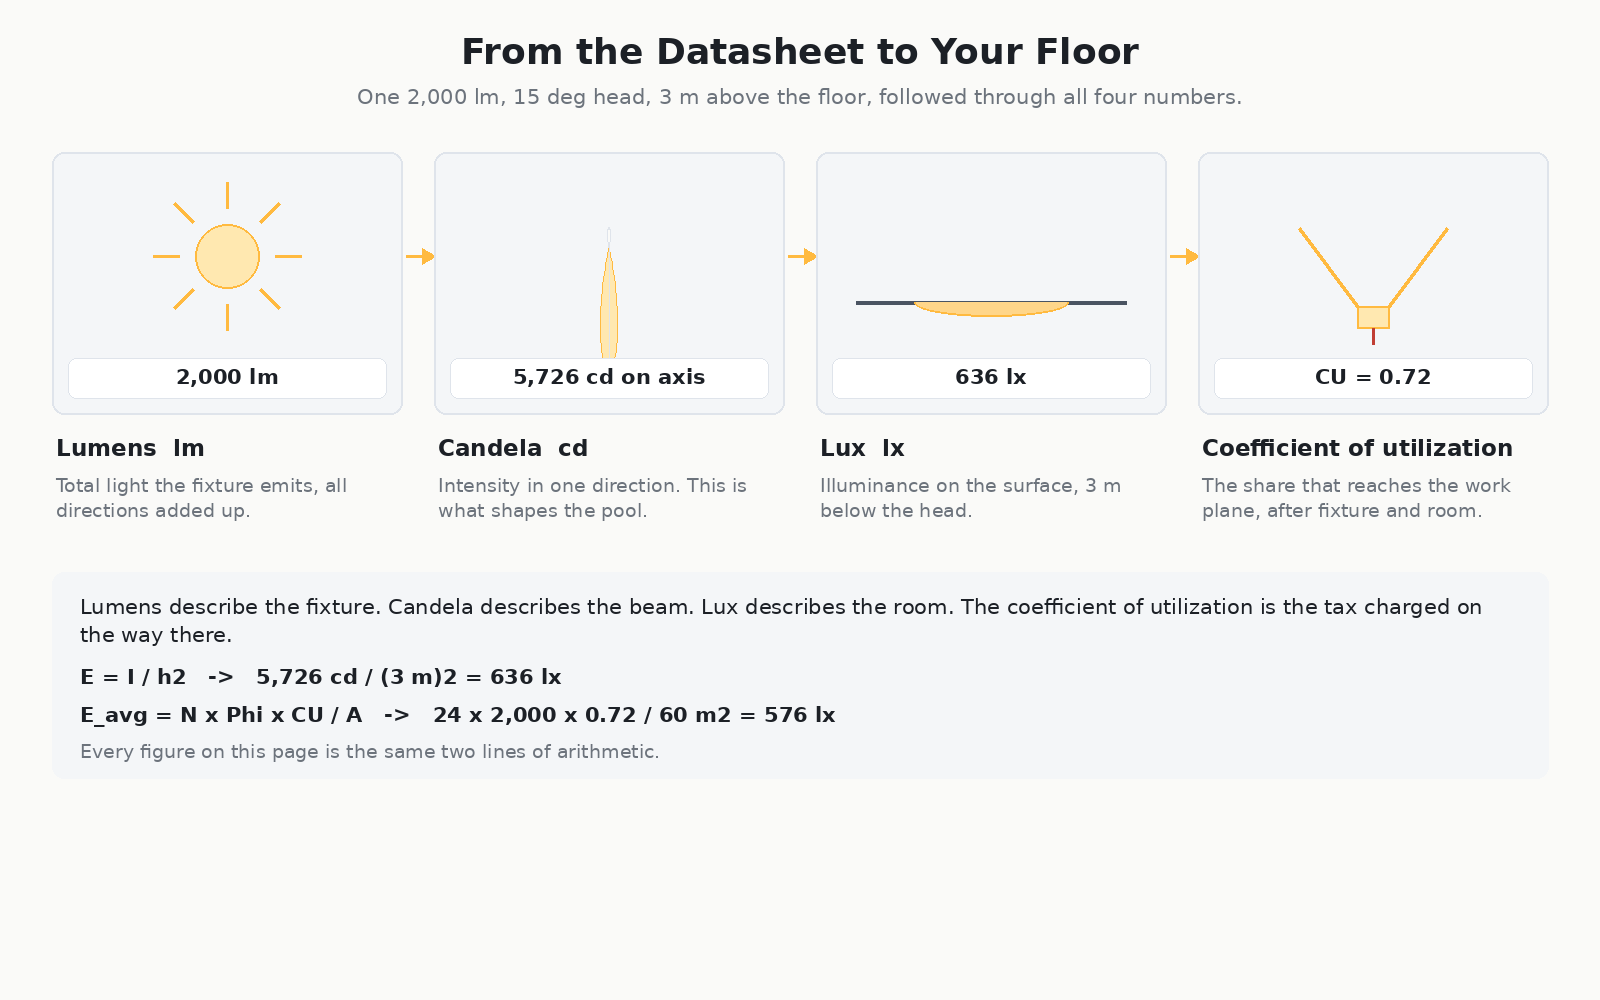
If you only remember one relationship, remember this: lumens describe the fixture, candela describes the beam, lux describes the room, and CU is the tax the fixture and the room charge on the way there. The rest of this article is the arithmetic behind that sentence.
A photometric report — sometimes called an IES file, a photometric file, or an LM-79 report — is generated by measuring the luminaire in an integrating sphere or a goniophotometer. The measurement is standardised: IES publishes the test and file-format standards that make two manufacturers’ numbers comparable, and the US Department of Energy sets out how LED performance is reported. A complete report has four blocks:
| Block | What it states | What it is for |
|---|---|---|
| Summary / absolute photometry | Lumens, watts, efficacy (lm/W), CCT, CRI, beam angle, power factor, total harmonic distortion | Quick fixture-to-fixture comparison and compliance |
| Intensity table (candela matrix) | Candela at every 5° or 10° of vertical and horizontal angle | Feeding design software; the source of every curve below |
| Polar candela distribution | The same data drawn as a polar curve | Judging beam shape, spill and glare at a glance |
| Illuminance and utilisation data | Iso-illuminance plot, CU tables, light output ratio, spacing criteria | Predicting lux and evenness on a real surface |
Two of those blocks are pictures and one is a wall of numbers. Most buyers look only at the summary block, which is why most buyers are surprised on site. The summary tells you how much light exists; the other three tell you where it goes.

Total lumen output is the headline number and the least useful one on its own. It is a sum over every direction — including the large share that a wide-beam luminaire throws into the ceiling and the wall behind it, where you never wanted it.
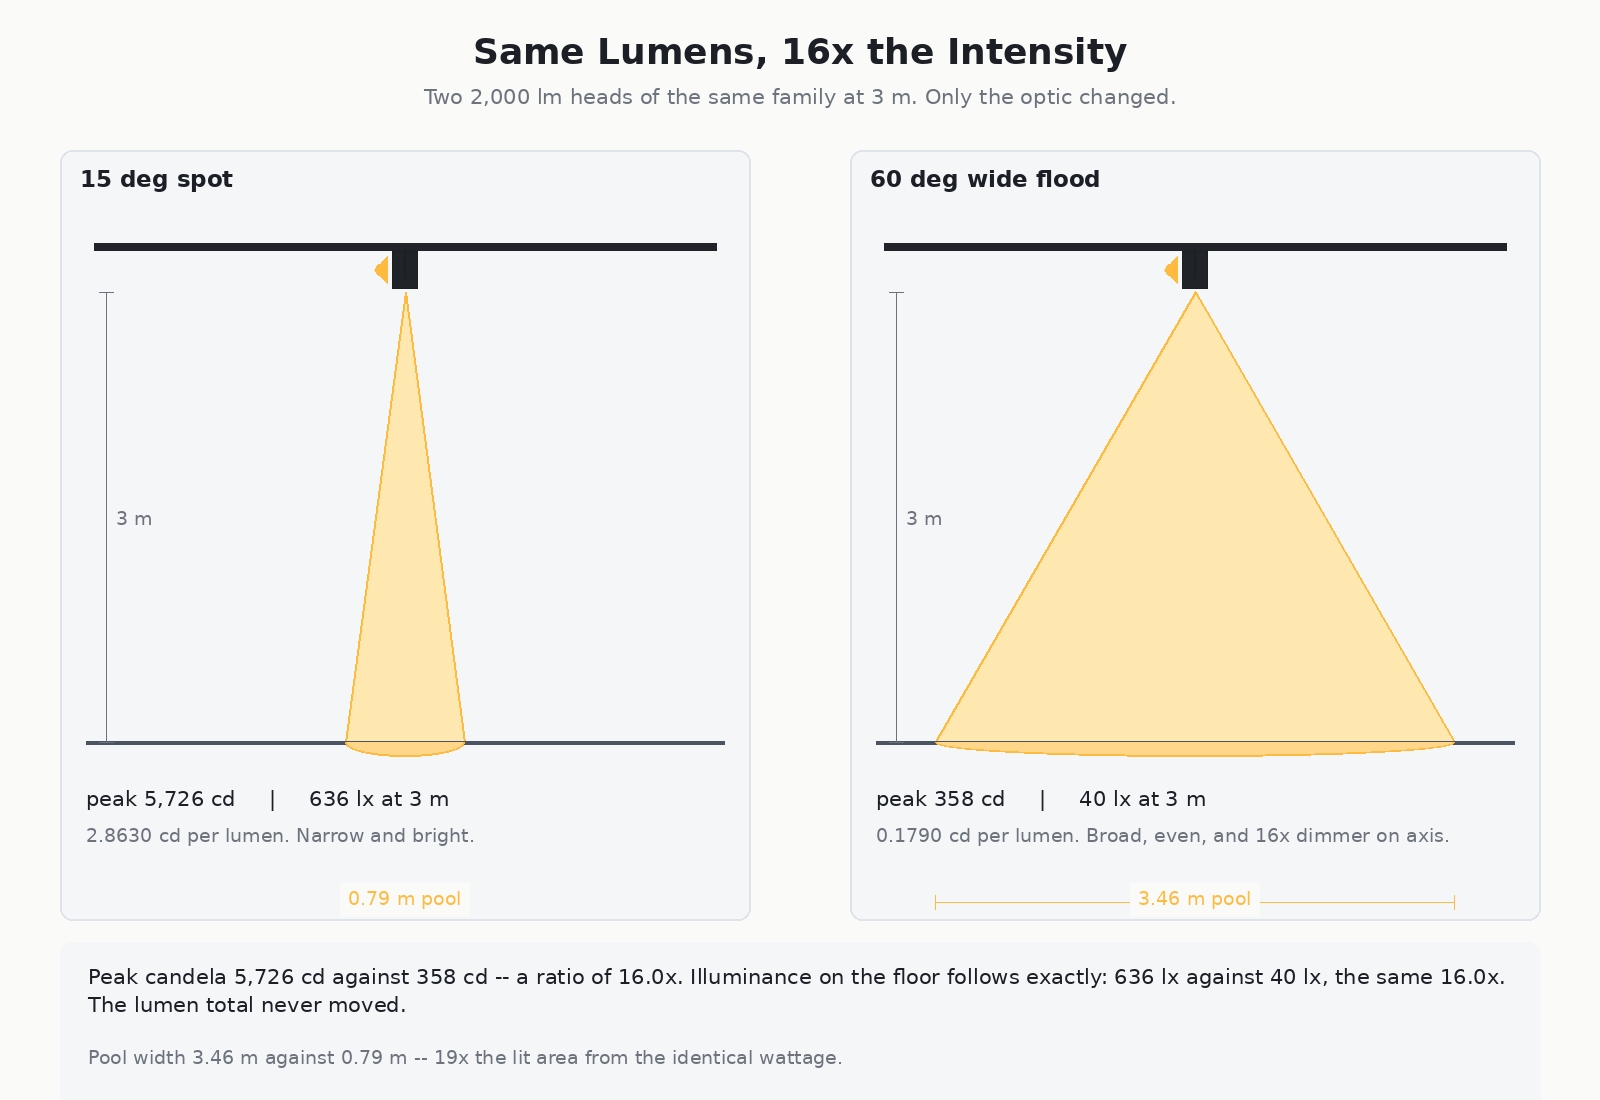
Two 2,000 lm heads illustrate the problem. One is a 15° spot, one is a 60° wide flood, both at 3 m above the surface:
| Metric | 15° spot | 60° wide flood | What changed |
|---|---|---|---|
| Lumens emitted | 2,000 lm | 2,000 lm | Identical — the headline number says nothing |
| Peak intensity | 5,726 cd | 358 cd | 16× difference in the on-axis direction |
| Illuminance at 3 m | 636 lx | 40 lx | 16× — enough to light a bench, or a hallway |
| Pool diameter at 3 m | 0.79 m | 3.46 m | Same lumens, 19× the lit area |
Both fixtures are the same “brightness” on the box. One will make a retail display pop and the other will flatten the room into an even, characterless wash. This is the first reason a photometric report exists: the total tells you the budget, the distribution tells you the result.
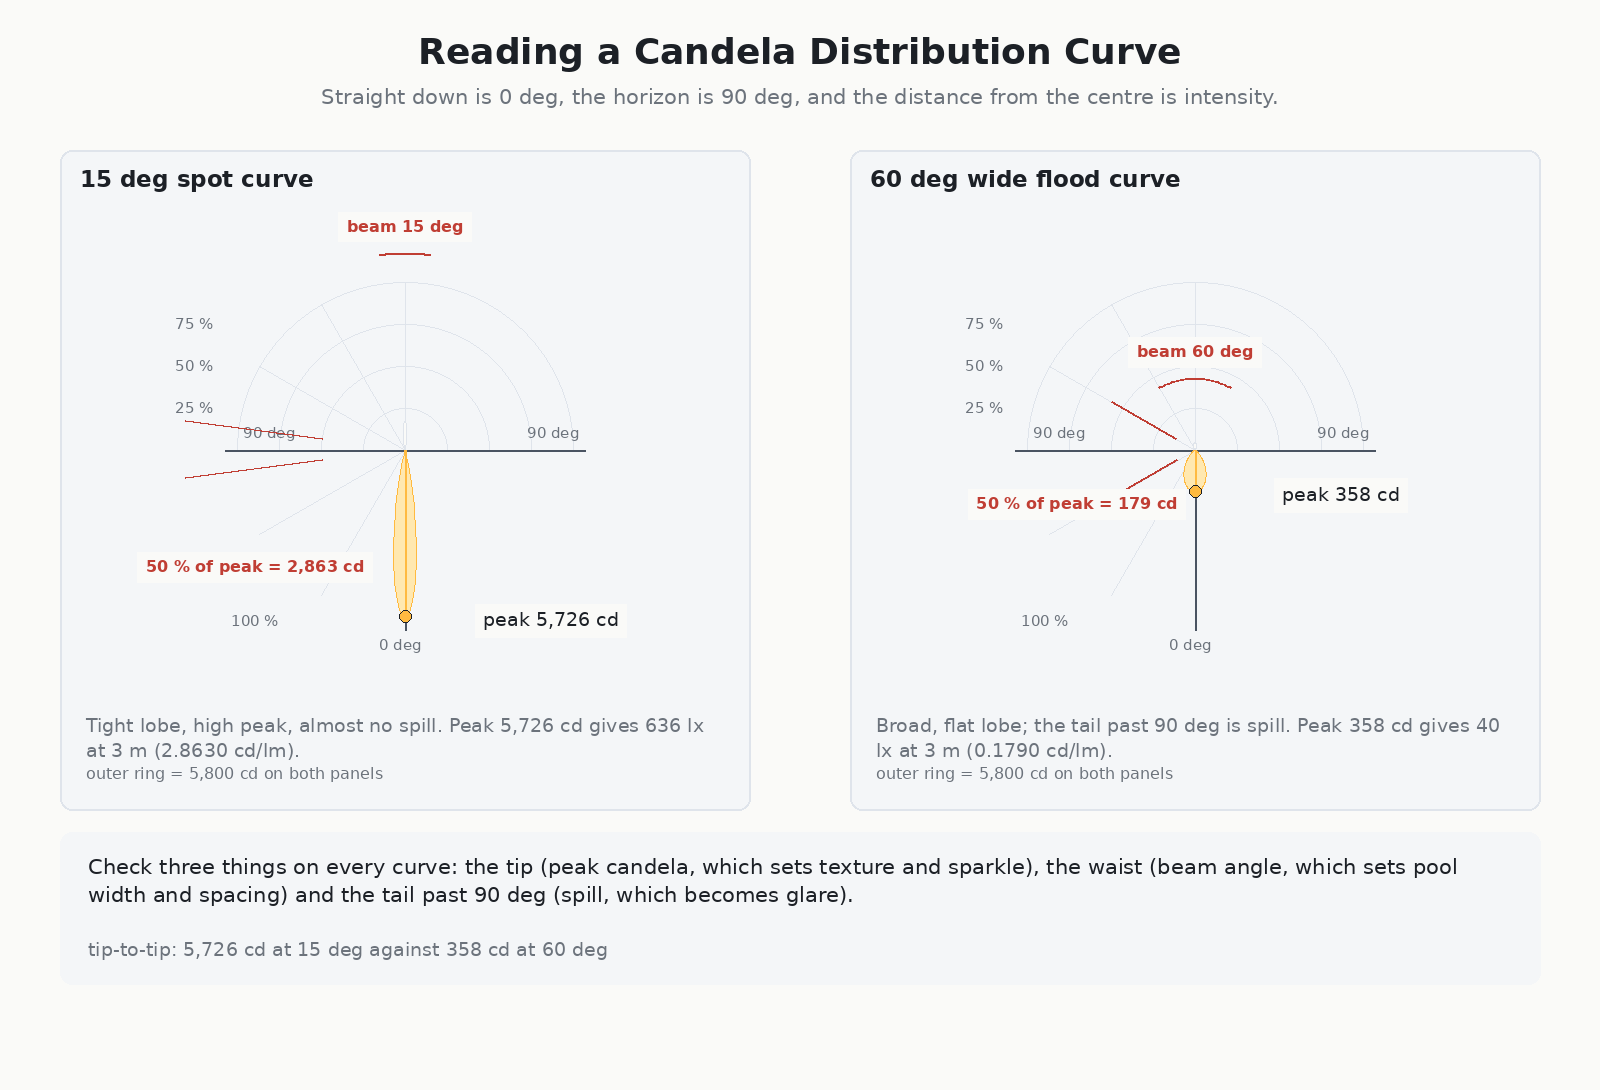
The polar curve is the most information-dense drawing in the report. It is drawn as a half-circle: straight down is 0°, out to the side is 90°, and the distance from the centre to the curve is the intensity in candela at that angle.
How to read one in about ten seconds:
Two numbers on the curve are worth converting straight into the room. The on-axis illuminance at distance h is simply the inverse-square law applied to the peak candela:
E = I / h²
E = illuminance in lux | I = intensity in candela in that direction | h = distance in metres
At 3 m, 5,726 cd gives 636 lx. Move the same head to 4.2 m and it gives 325 lx — barely half, and 1.96× less than the plot that came with it promised. That single equation is why raising a track light head from 3 m to 6 m forces you to double your spacing and roughly quadruple your fixture count for the same floor illuminance.
Candela is what the fixture delivers; lux is what the surface receives. The gap between them is geometry, and it is where specification mistakes live.
| Quantity | Unit | Describes | Depends on the room? |
|---|---|---|---|
| Luminous flux | lumen (lm) | All light emitted by the fixture | No |
| Luminous intensity | candela (cd) | Light emitted in one direction | No |
| Illuminance | lux (lx) | Light falling on a surface | Yes — distance and angle |
| Luminance | cd/m² | Light leaving a surface, i.e. perceived brightness | Yes — surface reflectance |
The practical consequence: two installers can hang the same luminaire and measure completely different lux numbers. If the report gives you 636 lx at 3 m and your meter reads 598 lx, the fixture is not lying — your aiming is off axis, or your surface is not perpendicular. A cosine-corrected drop of 20° costs about 6 %; a 45° off-axis tilt costs nearly 30 %; a 60° tilt halves it.
Luminance is the number your eye actually judges, and it is why glare control matters more than raw output. A 2,000 lm fixture in a deep baffle can look dimmer and better than a 3,000 lm fixture with a bare lens.

Now the number nobody reads. The coefficient of utilization is the fraction of the luminaire’s lumen output that arrives on the work plane. It is not a property of the fixture alone — it is a property of the fixture and the room, which is exactly why it is worth understanding.
E_avg = (N × Φ × CU) / A
N = number of luminaires | Φ = lamp lumens each | CU = coefficient of utilization | A = floor area in m²
The room already took its cut before the light got anywhere useful. Three effects do the damage:
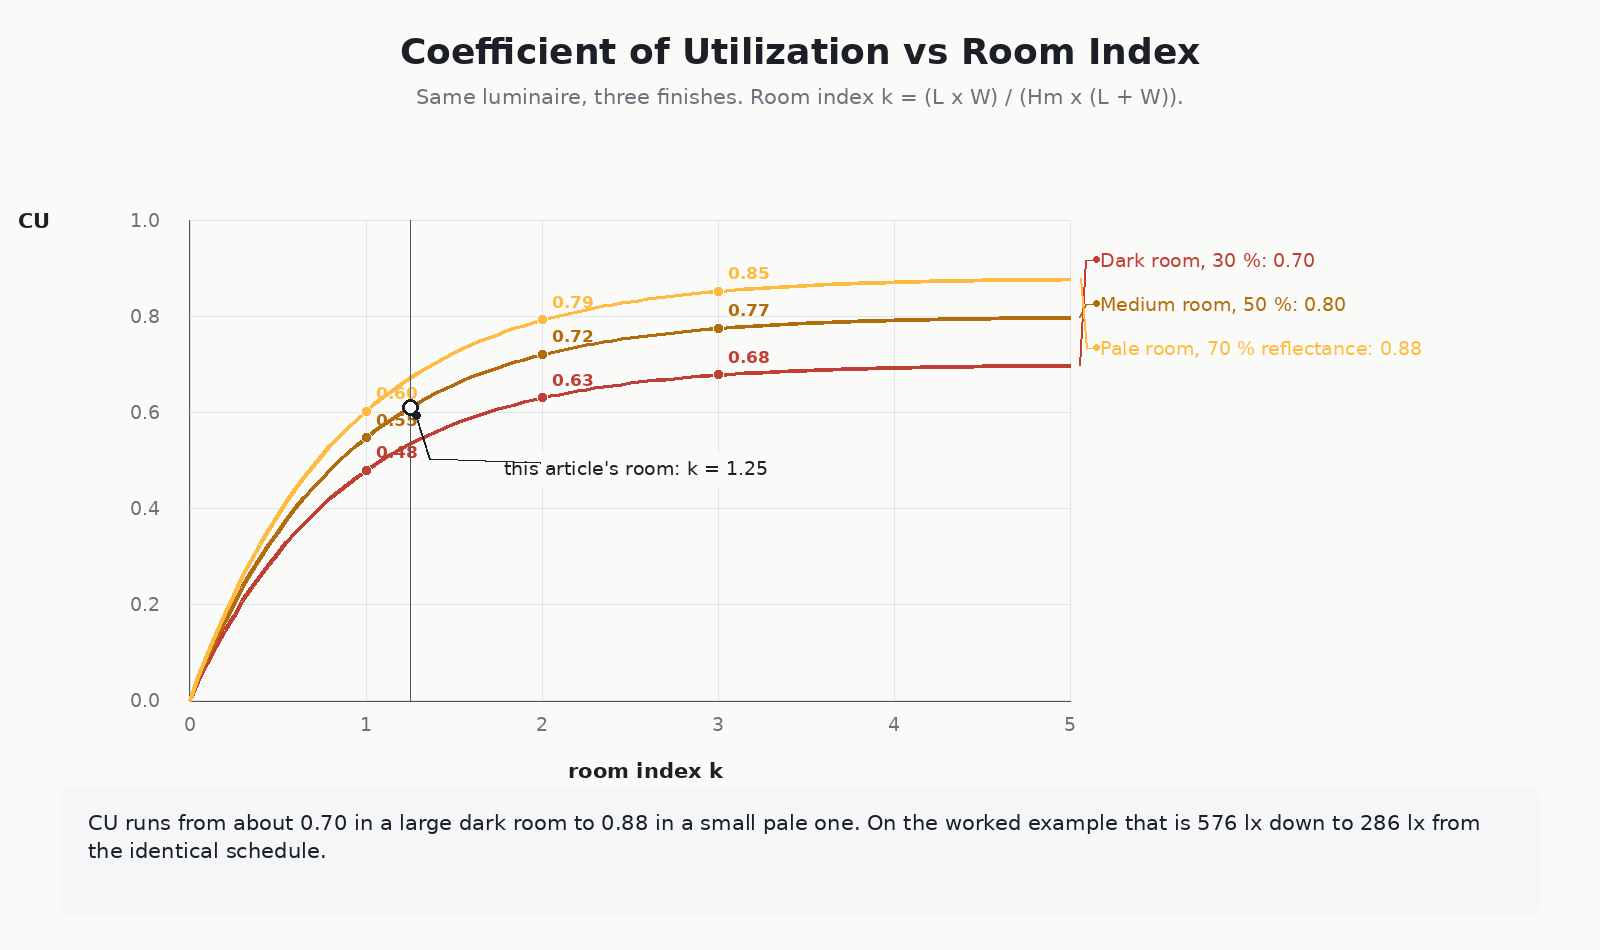
Values run from about 0.35 to 0.80 for typical interiors. That is not a rounding error — it is a factor of more than two between a favourable and an unfavourable room. Because CU is a term in both the numerator and the lumen budget, it moves the lux level you are targeting every bit as much as fixture count does.

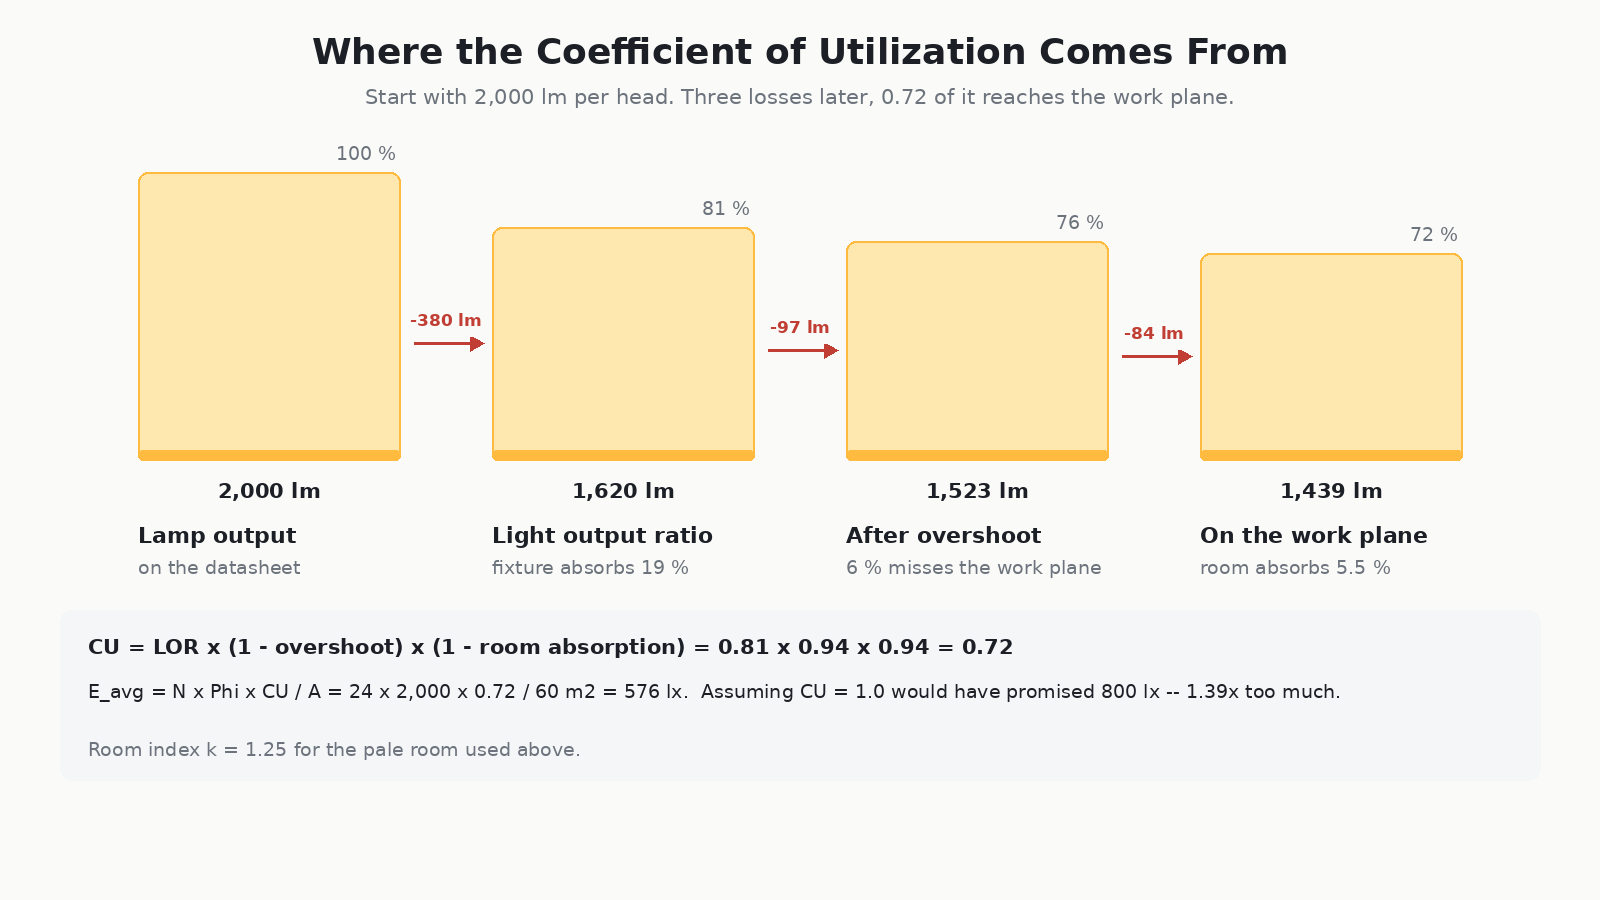
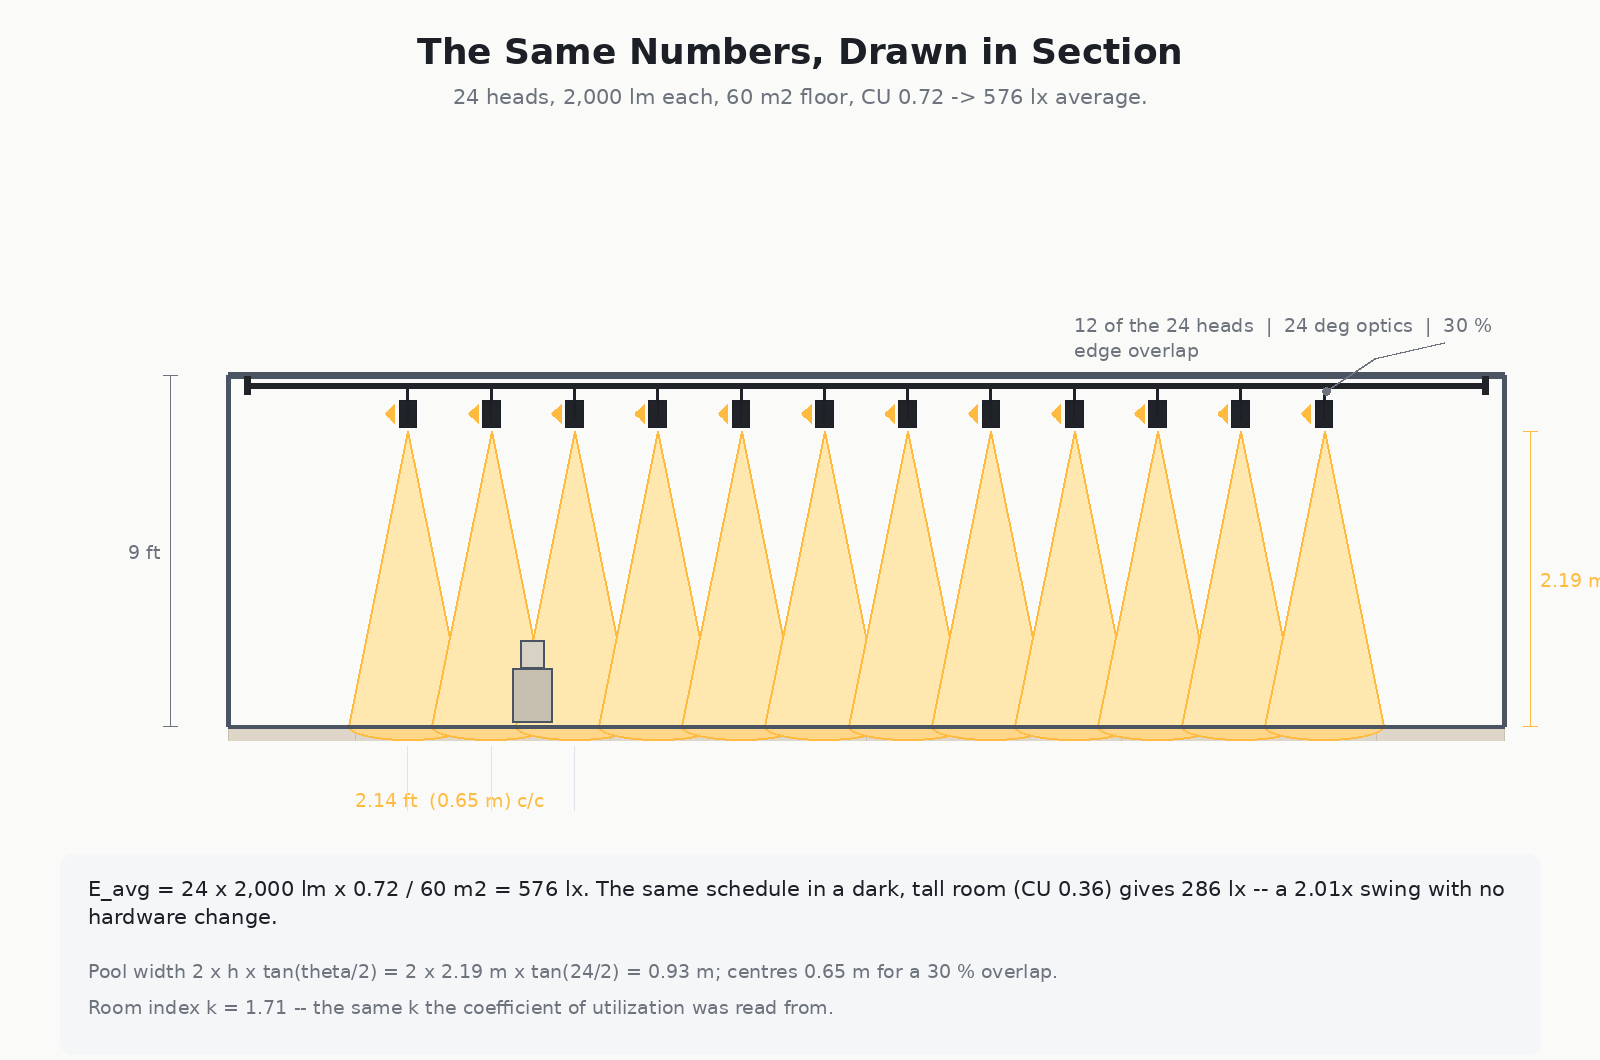
Here is a gallery project specified entirely from report numbers. Track-mounted heads, warm white, 24° optics, two rails of twelve heads over a 10 m × 6 m floor.
| Input | Value | Source |
|---|---|---|
| Lamp lumens per head (Φ) | 2,000 lm | Report summary block |
| Heads (N) | 24 | Layout drawing (2 rails × 12) |
| Mounting height below the rail | 2.19 m (ceiling 2.74 m) | Section drawing |
| Pool per head at that height | 0.93 m (24° optic) | 2 × h × tan(θ/2) |
| Coefficient of utilization (CU) | 0.72 | CU table at room index 1.71, pale finish |
| Floor area (A) | 60 m² | Plan |
| Average illuminance | 24 × 2,000 × 0.72 / 60 = 576 lx | Computed |
| What a naive CU of 1.0 would have implied | 800 lx | 39 % optimistic |

The gap between 576 and 800 lx is the whole reason CU is in the standard. Multiply that error across a 24-head schedule and you are either buying seven extra fixtures or shipping a gallery that measures one zone too dark on opening night.
Run the same figure in a darker, taller room — CU falls to 0.36 — and the identical hardware delivers 286 lx. Same report, same lumens, half the light on the floor.
An iso-illuminance plot (a contour or “iso-lux” diagram) is the report’s plan view: nested outlines, each labelled in lux, showing how the light spreads across the floor for one specified mounting height and spacing.
What to look at, in order:
Always check the mounting height printed on the plot. A plot drawn at 3 m says nothing about what happens at 4.2 m, because illuminance falls with the square of the distance. If the geometry changes, the plot changes.

The coefficient of utilization is normally published as a table or a family of curves, indexed by room index and the reflectance of the room surfaces. Room index is a single number that captures how much room there is to bounce light around in:
k = (L × W) / (Hm × (L + W))
L and W = room length and width in metres | Hm = mounting height above the work plane
The gallery above gives k = (10 × 6) / (2.19 × 16) = 1.71. That is a small, tall-ish room, which is why its CU lands in the middle of the useful band rather than at either extreme.
Read the curves at your own k, and at your own finish — not at the top of the table. The difference between the best and worst case is the difference between a project that meets the brief and a project that needs a second order of fixtures.
Before any luminaire reaches a purchase order, four lines of arithmetic catch most of the damage:
Notice that none of the four needs a consultant’s fee. They need the photometric file, a calculator and the room’s dimensions — and they take about ten minutes per luminaire, once.


A photometric report is the measured performance document for a luminaire. It records total lumen output, intensity in candela at every angle, the resulting polar distribution curve, illuminance or iso-lux data, and the coefficient of utilization tables — all captured under standard test conditions so that two manufacturers’ luminaires can be compared directly.
Lumens measure total light emitted in all directions by the fixture. Candela measures intensity in one specific direction. Two luminaires with identical lumen output can differ by more than sixteen times in on-axis candela if one has a narrow optic and the other a wide one, which is why candela — not lumens — determines how a light pool reads in a room.
For a single head, apply the inverse-square law to the candela value in the direction of the surface: E = I / h², where I is candela in that direction and h is the perpendicular distance in metres. Then multiply by the cosine of any off-axis angle. For a room average, use E_avg = N × Φ × CU / A, where N is the number of luminaires, Φ the lumens each, CU the coefficient of utilization and A the floor area in square metres.
For interior luminaires with normal room finishes, values between 0.55 and 0.80 are typical, with the favourable end belonging to small, low rooms with pale surfaces. Below 0.45 usually means a large, dark or high room, or a luminaire throwing much of its output where the work plane is not. Never assume 1.0 — that assumption alone overstated the worked example in this article by 39 %.
Yes, provided the files were produced under the same test method and at the same drive current and ambient conditions. Compare peak candela and beam angle rather than wattage, check the light output ratio and CU at your room’s own room index, and read the high-angle candela before comparing price.
For a single fixture in a residential room it is optional, though still useful. For retail, gallery, hospitality or museum work it is essential: those are the projects where uniformity, glare control and accent-to-ambient ratios are specified, and every one of those figures comes from the report rather than from the box.
Photometric lighting design is not a secret held by specifiers. A report states four things — how much light leaves the fixture in lumens, how it is aimed in candela, how much of it survives to the work plane as the coefficient of utilization, and what actually falls on your floor in lux. Read those four in that order and almost every luminaire decision becomes an arithmetic check rather than a gamble.
Do it once per product family and the numbers become instinct: you will spot a wide optic pretending to be a spot, and a beautiful catalogue shot with a 0.4 CU room behind it, from the first page of the file.
If you would rather hand the file over, we do this daily. Our track light range ships with IES files and LM-79 reports for every head, and our downlight range comes with the same documentation — so the check takes minutes rather than a week. Or send us your drawing and target lux and we will return a photometric summary, a layout and a fixture schedule.